
Integrate Resources and Modify Forecasts
7.1 Revise Demand Forecast
Table 7.1a – St. Charles Mesa Water District Modified Demand Forecast
Worksheet 7-1: Modified Demand Forecast

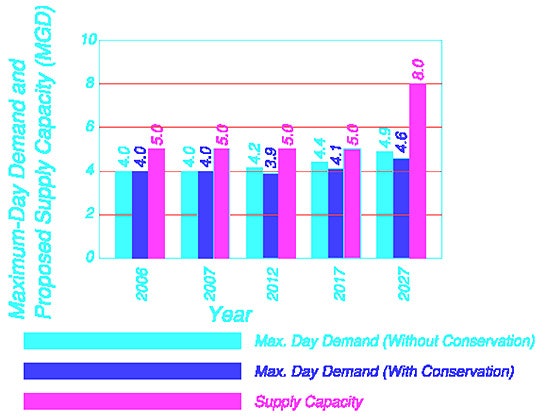
Figure 7.1b – St. Charles Mesa Water District Maximum-Day Demand and Proposed Supply Capacity (With and Without Conservation)

7.2 Identify Project Specific Savings
The following Table 7.2 is from Worksheet 7-2, which details the savings from postponing the installation of a 2 MGD filter, for 10 years
Table 7.2 – St. Charles Mesa Water District Project Specific Savings. Click table below to enlarge.

7.3 Revise Supply-Capacity Forecast
At present, there are no CIP's, associated with the distribution system, which are intended to be removed or delayed by the conservation measures mentioned above. This is mainly due to the fact that the areas which have been targeted for replacement, in the CIP, are comprised of the oldest, most undersized portion of the distribution system. The improvements outlined in the CIP are also intended to increase the efficiency of the distribution system, and help eliminate potential leaks.
Table 7.3 – St. Charles Mesa Water District Modified Supply Forecast
Worksheet 7-3: Modified Supply Forecast and Estimated Total Savings
7.4 Summarize Forecast Modifications and Benefits of Conservation
The following bar graph represents the Maximum-Day Demand with and without conservation, and the total supply capacity, assuming that the proposed 2MGD upgrade, originally scheduled for 2012, being postponed until 2022.
Figure 7.2 – St. Charles Mesa Water District Maximum-Day Demand and Revised Supply Capacity (With and Without Conservation)
It appears that the 2MGD upgrade in 2012, can be postponed by at least 10 years, and in fact, the 1 MGD upgrade scheduled for 2020 may be sufficient on its own, as a supply capacity of 6.0MGD will be sufficient to meet the demand, particularly if the conservation measures and programs are successful.
7.5 Consider Revenue Effects
Table 7.4 – St. Charles Mesa Water District Revenue Effects from Conservation.
From Table 7-4, it appears that the increased revenue from growth will outpace the loss of revenue from the Conservation Measures and Programs, if implemented according to the plan. The only loss in revenue is in the Institutional Sector. This is because there are no new schools anticipated within the planning time frame.