
Characterize Water Use and Forecast Demand
2.1 Current Water Use
The following is a summary of water use by customer class. There are three distinct classes. 1-Residential, 2-Commercial and 3-Institutional (Schools).
Table 2.1a – St. Charles Mesa Water District Total Use per Customer Class
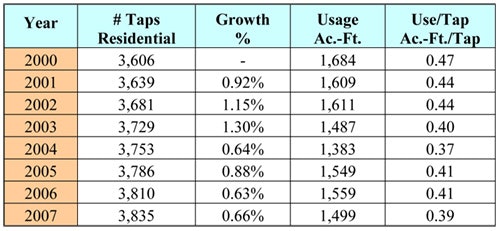

From the above data, it can be seen that the majority of the Residential customers have shown a steady decrease in irrigation use. There is a small increase beginning again in 2005, but subsequent years (2006, 2007) have indicated a slow decrease. It is belief that the summer after the drought (2004) a slight increase occurred since residences were no longer under voluntary lawn watering restrictions. The Commercial customers reflect a similar pattern between 2001 and 2007. The Institutional customers have shown an overall increase in lawn irrigation between 2004 and 2007. This is partially due to the fact that some of the facilities have added new areas which need to be irrigated.
In order to quantify the in-house use vs. irrigation usage, the total use during the winter months (December – March) was used as a baseline to determine average monthly in-house water usage. The following table illustrates the “winter usage” for all use categories.
2.1b – St. Charles Mesa Water District Average Winter Water Usage
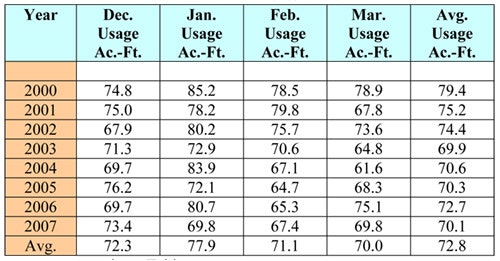
The above Table 2.1b is calculated for all use sectors.
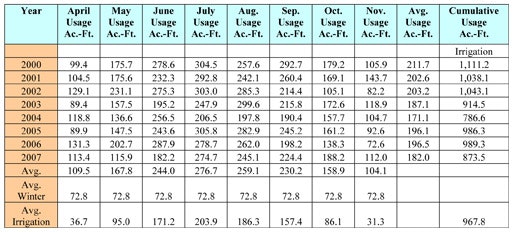
The irrigation use is calculated as the difference of the total use during April through November less the average use between December through March, and yields the following:
Table 2.1c – St. Charles Mesa Water District Average Irrigation Usage (Click the table below to enlarge)
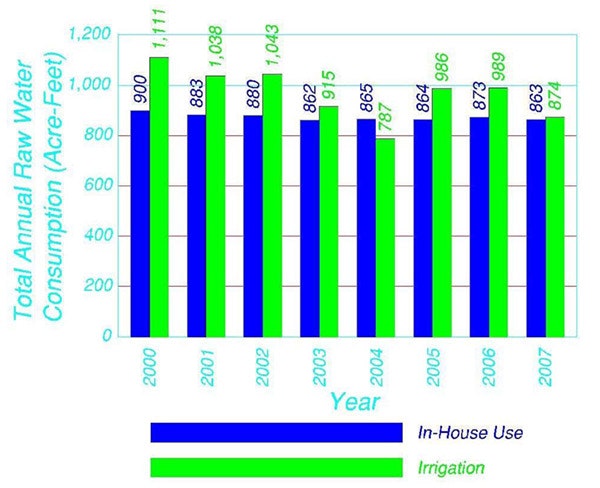
The average irrigation water use from 2000 to 2007 is 52.7% of the total annual water consumption. The overall use trend is downward, from 2003 during the extended drought. The irrigation use has continued to lag behind pre-drought years, immediately preceding this period. The following graph explains the total, annual, in-house use and total irrigation use, by calendar year.
Figure 2.1 – St. Charles Mesa Water District Total Annual Raw Water Consumption
The following is a list of the 6 customers with the highest usage, from the period of May, 2008 to April, 2009:
Table 2.1d – St. Charles Mesa Water District – Largest Water Use by Customer (Click the table below to enlarge)
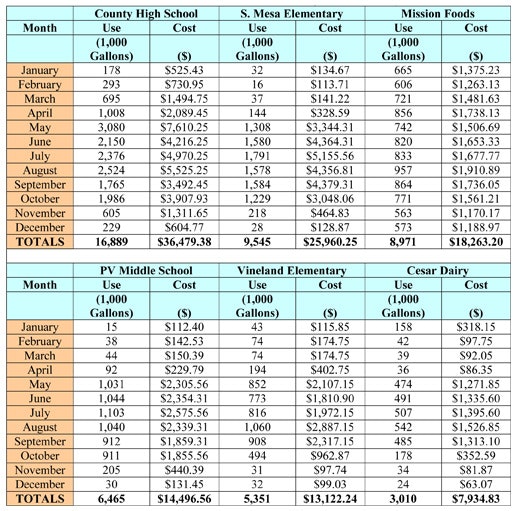
Irrigation of large areas of lawn is the reason for the increased usage during the irrigating season, for the four Institutional (public schools) customers listed above. The exceptions are Mission Foods, whose usage is more directly related to its business operation, and Cesar Dairy, which uses some of its water for cattle watering. The District has provided resources related to efficient irrigation methods to all of these customers, particularly to School District No. 70. During 2002 this information was disseminated as an information packet in the monthly water bills. The following is a summary of the resource information:
- When brushing your teeth, or shaving, don’t let the water run continuously. Use a glass of water when brushing teeth, and only run water when cleaning razor.
- Bathe in the tub when possible, filling tub with just a few inches of water. Showers should be as brief as possible. Turn off water while lathering up and then back on to rinse.
- Keep a large plant watering container near the faucet. While waiting for hot water, simply capture the cold water in the watering container, until hot water is available. The captured water should be used to water plants.
- When doing laundry or using dish washer, always run full loads. If you can’t wait, make sure the water level setting is correct.
- Always repair leaks in faucets, toilet tanks, control valves and sprinklers. A small leak can waste up to 6,000 gallons per year.
- Run your evaporative cooler only when necessary. An evaporative cooler can use 10 to 30 gallons per day. Run your cooler vent as much as possible until the temperature in your home requires you to cool.
- Water only in the early morning or late evening, to reduce evaporation. Keep sprinklers adjusted so they are not spraying sidewalks and driveways. If you have a dry spot, water by hand. Mow your lawn at no lower than 3 inches, to help it keep the moisture in the soil.
- Water trees and shrubs by hand. Don’t let water run unattended.
- Don't wash your patios or sidewalks. Sweep them off.
- Washing your car should be done using a bucket or a hose with a control valve. Don’t let the hose run, even on your lawn.
- One inch of water a week, is generally recommended, to maintain a viable landscape, including vegetables, turf, trees and flowers.
- One inch of water:
- Over 1,000 square feet = 624 gallons. Over 1-acre = 27,200 gallons.
- At a rate of 10 gallons per minute, it will require approximately 1 hour to add 1 inch of water, to a 1,000 square foot lawn.
- One Gallon = 15,100 drops, 16 cups, 8 pints, 4 quarts, 128 fluid ounces, 8.34 pounds.
- One Cubic foot of water contains 7.48 gallons of water.
- 1-acre•foot of water = 12” (one foot) deep, over 1-acre (43,560 square feet) = 325,851 gallons.
All of the above information is available at the District's web site: http://www.stcharlesmesawaterdistrict.org/
Additionally, Mr. David Simpson had individually contacted the Institutional customers during that same period. This limited program met with some success, which can be seen in Table 2.1a, on sheet 8. During 2002, there was a substantial drop in use, from the previous year.
2.2 Forecasting Method
The forecast demand is projected in Worksheet 2-1, by the number of taps, and also by population. The forecast is based on a growth rate of 1%.
2.3 Demand Forecast
The demand forecast shown below is for all users, regardless of type. This does not include any water conservation, other than the voluntary programs which are in currently in place.
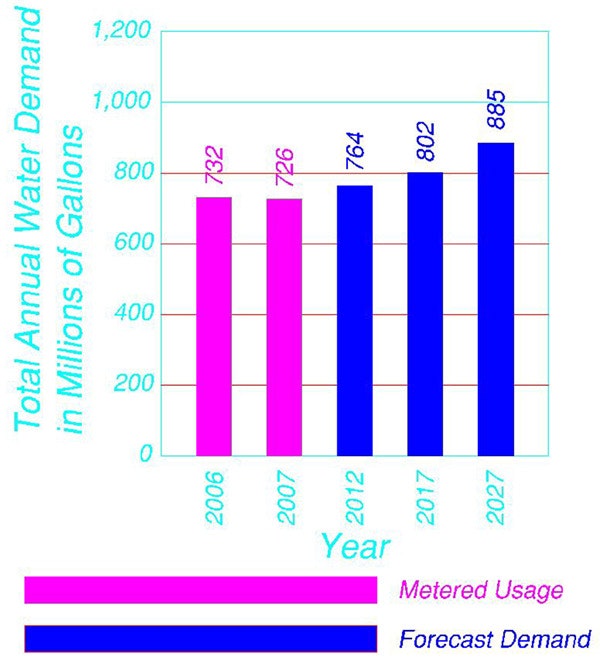
Figure 2.3 – St. Charles Mesa Water District Forecast Demand without Conservation